1.7. Dimension Reduction
1.7.1. Introduction
This example shows how to use pSeven Core for dimension reduction.
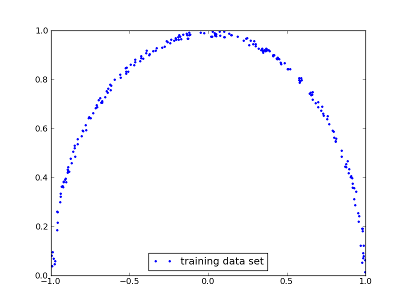
Consider a set of points in 2D which form some curve (here, a semicircle), so they can be compressed to 1D.
Start by importing the Generic Tool for Dimension Reduction (GTDR) module:
from da.p7core import gtdr
1.7.2. Model Training
Generate the source (uncompressed) data sample:
import numpy as np

xx = np.random.uniform(low=-1.0, high=1.0, size=20000).reshape((10000, 2))
data = np.array(list(filter(lambda x: x[0]**2 + x[1]**2 < 1 and x[0]**2 + x[1]**2 > 0.95 and x[1] > 0, xx)))
If you have Matplotlib installed, you may visualize these points:
import matplotlib.pyplot as plt

plt.plot([item[0] for item in data], [item[1] for item in data], '.', label='Training data set')
plt.legend(loc='best')
plt.show()
Create a gtdr.Builder instance:
builder = gtdr.Builder()
You can set options (see Options Interface), logger and watcher for the builder:
from da.p7core import loggers

# sefault StreamLogger: log to stdout, verbosity level is info
builder.set_logger(loggers.StreamLogger())

# always return True, so building is not interrupted; watcher may be unset, which gives the same effect
builder.set_watcher(lambda obj: True)

# do not change any options, only print a list of available options
print(builder.options.list)
Compress data (x=data) to 1D space (dim=1). Dimension Reduction Task 2 formulation is used.
model = builder.build(x=data, dim=1)
1.7.3. Using the Model
Print a readable model summary:
print(model)
Save the model and reload it from disk:
model.save('semicircle.gtdr')
loaded_model = gtdr.Model('semicircle.gtdr')
Compression and decompression models can also be exported to the Octave format. Note there are two distinct export methods:
format = "octave"
name = "semicircle_compress"
description = "Example compression model."
file = "semicircle_compress.m"
model.compress_export_to(format, name, description, file)

format = "octave"
name = "semicircle_decompress"
description = "Example decompression model."
file = "semicircle_decompress.m"
model.decompress_export_to(format, name, description, file)
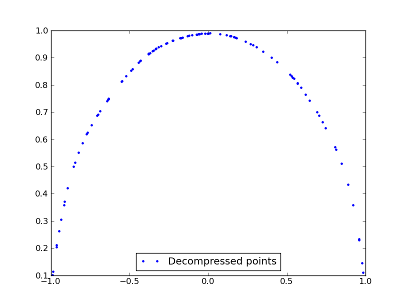
Generate some points in the compressed space and decompress it to verify that the model is valid:
# compress the training sample
training_compressed = loaded_model.compress(data)

# generate 100 random points in compressed space
compr = np.random.uniform(low=np.min(training_compressed), high=np.max(training_compressed), size=100).reshape((100, 1))

# decompress the generated sample
decompr = loaded_model.decompress(compr)
Print generated points:
print(compr)
print(decompr)
1.7.4. Full Example Code
import numpy as np

from da.p7core import gtdr
from da.p7core import loggers

xx = np.random.uniform(low=-1.0, high=1.0, size=20000).reshape((10000, 2))
data = np.array(list(filter(lambda x: x[0]**2 + x[1]**2 < 1 and x[0]**2 + x[1]**2 > 0.95 and x[1] > 0, xx)))
print(data)

builder = gtdr.Builder()
builder.set_logger(loggers.StreamLogger())
print(builder.options.list)

model = builder.build(x=data, dim=1)
print(model)

model.save('semicircle.gtdr')
loaded_model = gtdr.Model('semicircle.gtdr')
format = "octave"
name = "semicircle_compress"
description = "Example compression model."
file = "semicircle_compress.m"
model.compress_export_to(format, name, description, file)

format = "octave"
name = "semicircle_decompress"
description = "Example decompression model."
file = "semicircle_decompress.m"
model.decompress_export_to(format, name, description, file)

# Compress training sample.
training_compressed = loaded_model.compress(data)

# Generate 100 random points in compressed space.
compr = np.random.uniform(low=np.min(training_compressed), high=np.max(training_compressed), size=100).reshape((100, 1))

# Decompress points.
decompr = loaded_model.decompress(compr)

print(compr)
print(decompr)
If you have Matplotlib installed, you may visualize these points:
import matplotlib.pyplot as plt
plt.clf()
fig = plt.figure(1)
plt.plot([item[0] for item in data], [item[1] for item in data], '.', label='Training data set', color='b')
plt.plot([item[0] for item in decompr], [item[1] for item in decompr], '.', label='Decompressed points', color='r')
plt.legend(loc='best')
fig.savefig('GTDR')
plt.show()
Check that they really form a semicircle: